Product Design · Enterprise · AI/ML
Redesigning Panacea.ai — an AI-powered log analysis platform for Nutanix Site Reliability Engineers
to unify fragmented workflows and cut root cause analysis time by 87.5%.
COMPANY
Nutanix
DURATION
8 Months
ROLE
Product Designer
TOOLS
Figma · FigJam
PHASE
Phase 1 · Shipped
SCROLL TO EXPLORE
87.5%
Reduction in root cause analysis time
45
UAT users in pilot testing
405
Log bundles analyzed in testing
8min
Average processing time per
bundle
00 — BUSINESS CONTEXT
The business problem behind the tool problem..
SLA EXPOSURE
Every minute of delay is contractual risk
Slow root cause analysis directly threatened Nutanix's enterprise SLA commitments. At the enterprise tier, time-to-resolution isn't a metric — it's a legal obligation. Delayed diagnosis meant SLA breach risk on every open incident.
ESCALATION COST
Junior SREs couldn't close cases independently
Junior SREs couldn't resolve complex cases without pulling in senior engineers. Escalation rates were burning senior talent on work that shouldn't require them — a hidden headcount cost compounding across every shift.
RETENTION RISK
Tool fatigue was eroding
morale
SREs reported context-switching fatigue as a core frustration — not a minor annoyance. Tool fragmentation was eroding confidence and morale in a role already under pressure. This wasn't showing up in support metrics, but it was showing up in people.
Design reframe: A faster, unified RCA tool wasn't just better UX — it was a direct lever on SLA compliance, support org costs, and SRE satisfaction. Every design decision needed to connect to at least one of these three levers to earn its place in the product.
01 — THE PROBLEM
Fragmented tools.
Delayed diagnoses.
When a customer opens a support case, SREs had to juggle NCC, Panacea,
Insights, Remote Commands, Logs, and Service pages simultaneously — none of
which spoke to each other. Every minute spent context-switching was a minute a
customer waited.
sre_workflow.log — Before
[09:14:02] ALERT: Customer VM down — cluster xyz-prod-01
[09:14:05] → Open Panacea.ai ... scanning log bundle
[09:22:18] → Switch to Insights ... correlating raw metrics
[09:35:44] → Open NCC ... cross-checking health checks
[09:48:01] → Remote Commands ... pulling CVM service status
[10:03:17] → Back to Panacea ... re-reading log signatures
[10:14:52] RCA still incomplete. 1hr+ elapsed.
sre_workflow.log — After
[09:14:02] ALERT: Customer VM down — cluster xyz-prod-01
[09:14:05] → Panacea.ai Upload bundle → AI Summary generated
[09:22:05] ✓ Root cause identified. RCA drafted. 8 minutes.
PROBLEM 01
Tool Fragmentation
SREs had to navigate 5+ disconnected tools to complete a single RCA. Context-switching caused critical information to slip through the gaps, especially for junior engineers still building domain knowledge.
PROBLEM 02
Manual Interpretation Burden
Even with AI analysis from Panacea, engineers still had to manually cross-reference Insights data and interpret raw metrics. The AI "helped" but didn't eliminate the cognitive load.
PROBLEM 03
No Unified View
Log data, cluster health, CVM metrics, and historical patterns existed in silos. There was no single pane of glass where an SRE could see the full picture of a cluster incident at once.
PROBLEM 01
The Junior SRE Gap
Senior engineers could intuit correlations across tools. Junior SREs could not — leading to inconsistent troubleshooting quality, longer case resolution times, and excessive escalations.
PROBLEM 05 — THE HIDDEN ONE
Design, engineering, and product weren't speaking the same language
Behind the tool fragmentation was a team fragmentation: design decisions made in Figma weren't translating cleanly into engineering, and product couldn't communicate changes to leadership without a designer in the room. The communication breakdown was as real a blocker as the UX one. This became one of the explicit design problems to solve — not just a team dynamics issue.
02 — THE RESEARCH & DISCOVERY
2 months of
structured learning.
Designing for an unfamiliar domain required deep immersion. I embedded
myself in the product, the team, and the workflow before drawing a single frame.
STAKEHOLDER 01
SRE Team
Real-time cluster monitoring without tab-hopping
Quick incident resolution with AI-guided triag
Consistent process regardless of experience level
Script Wizard for common cluster operations
STAKEHOLDER 02
PM
User experience as a priority metric
Rapid feature prioritization and delivery
Clear visibility into design decisions
Roadmap alignment across all teams
STAKEHOLDER 03
Panacea Dev Team
Richer AI-powered summaries and conclusions
Strict adherence to design system guidelines
Detailed API contracts per feature
Technical documentation for each component
"Panacea AI provides a great foundation for building an enterprise-level troubleshooting tool for SREs. The tool is able to quickly parse large amounts of log data, identify known issues, and provide a view into key events. The RCA summary is a first step into providing an automated Root Cause Analysis tool."
— Pilot SRE Tester, Nutanix UAT Program
Deep Exploration of Existing Tools
Hands-on use of both Panacea.ai and Insights revealed the specific moments where engineers lost context, made errors, or gave up and escalated. These friction points became our design targets.
PRD & Grooming Sessions
Deep dives into the Product Requirements Document alongside recurring PM grooming sessions ensured design decisions were anchored in real requirements — not assumptions.
OOUX Exercise with Senior SRE
Object-oriented UX sessions helped map out every data entity in the system — bundles, signatures, CVM nodes, alerts, layers — and how they related to each other. This became the backbone of the information architecture.
Glean AI for Domain Knowledge
Used Glean AI to rapidly build understanding of Nutanix-specific infrastructure concepts — AOS, hypervisors, CVM services, NCC — enabling me to speak the same language as the SREs I was designing for.
03 — DESIGN PROCESS
How might we unify
without
overwhelming?
The HMW question guided every design decision: create a platform that serves
diverse technical skill levels, blends AI capabilities naturally, and stays scalable without
a fixed end-vision.
PHASE 01
Discovery
2 months
Stakeholder interviews, PRD analysis, domain learning, OOUX exercise
PHASE 02
Define
10 days
Report architecture, data mapping, requirements with Senior SRE
Phase 03
Ideate
10 days
FigJam flows, sketches, first-draft
UI explorations
Phase 04
Design
3 months
High-fidelity UI, iterative sessions with SREs, design system alignment
Phase 05
Test & Ship
~2 months
45 UAT testers, 405 bundles, feedback loops, iteration
THE PIVOT THAT CHANGED EVERYTHING
We got our primary user wrong.
We assumed senior SREs were the primary users — the ones who'd set the benchmark. We optimised for power-user density: deep data access, maximum configurability, raw log depth surfaced by default.
UAT showed junior SREs were handling 60%+ of triage. This completely reframed the information hierarchy — from power-user density to guided clarity with progressive disclosure.
What we changed: Promoted AI RCA Summary to the hero interaction. Buried raw log depth behind a reveal. Redesigned IA around guided → expert, not expert-first.
DESIGN AS PRODUCT DISCOVERY
Three features were never in the PRD.
They were found through structured design exercises with stakeholders — not roadmap planning. This was the clearest validation that design is a discovery method, not just a delivery method.
Combine Bundles — surfaced through SRE workflow observation sessions
CVM Configuration panel — emerged from the OOUX data-mapping exercise
Insights integration — identified through workflow fragmentation analysis
Structured exploration with stakeholders produces roadmap items that PM sessions miss. Defend that time.
04 — KEY DESIGN DECISIONS
What we built,
and why it matters.
Every feature was born from a real pain point uncovered during research. Each
addresses a specific failure mode in the original workflow.
NEW FEATURE
Panacea Reports
A completely new module enabling SREs to create and combine log bundles for cross-bundle correlation.
Turns isolated snapshots into a continuous cluster health narrative — critical for
multi-incident pattern detection.

Panacea Reports — cross-bundle correlation and cluster health narrative
AI-POWERED
AI RCA Summary
The most critical deliverable. Natural-language summaries of anomalies, ranked by severity,with affected CVM IPs highlighted.
Multi bundle analysis provided in event timeline with option to view only the curated events, improved the focus area to for SREs.
Transforms raw log data into an actionable diagnosis in seconds — not hours.
Before

After

AI RCA Summary — before/after. Note the shift from raw log output to structured, ranked diagnosis.
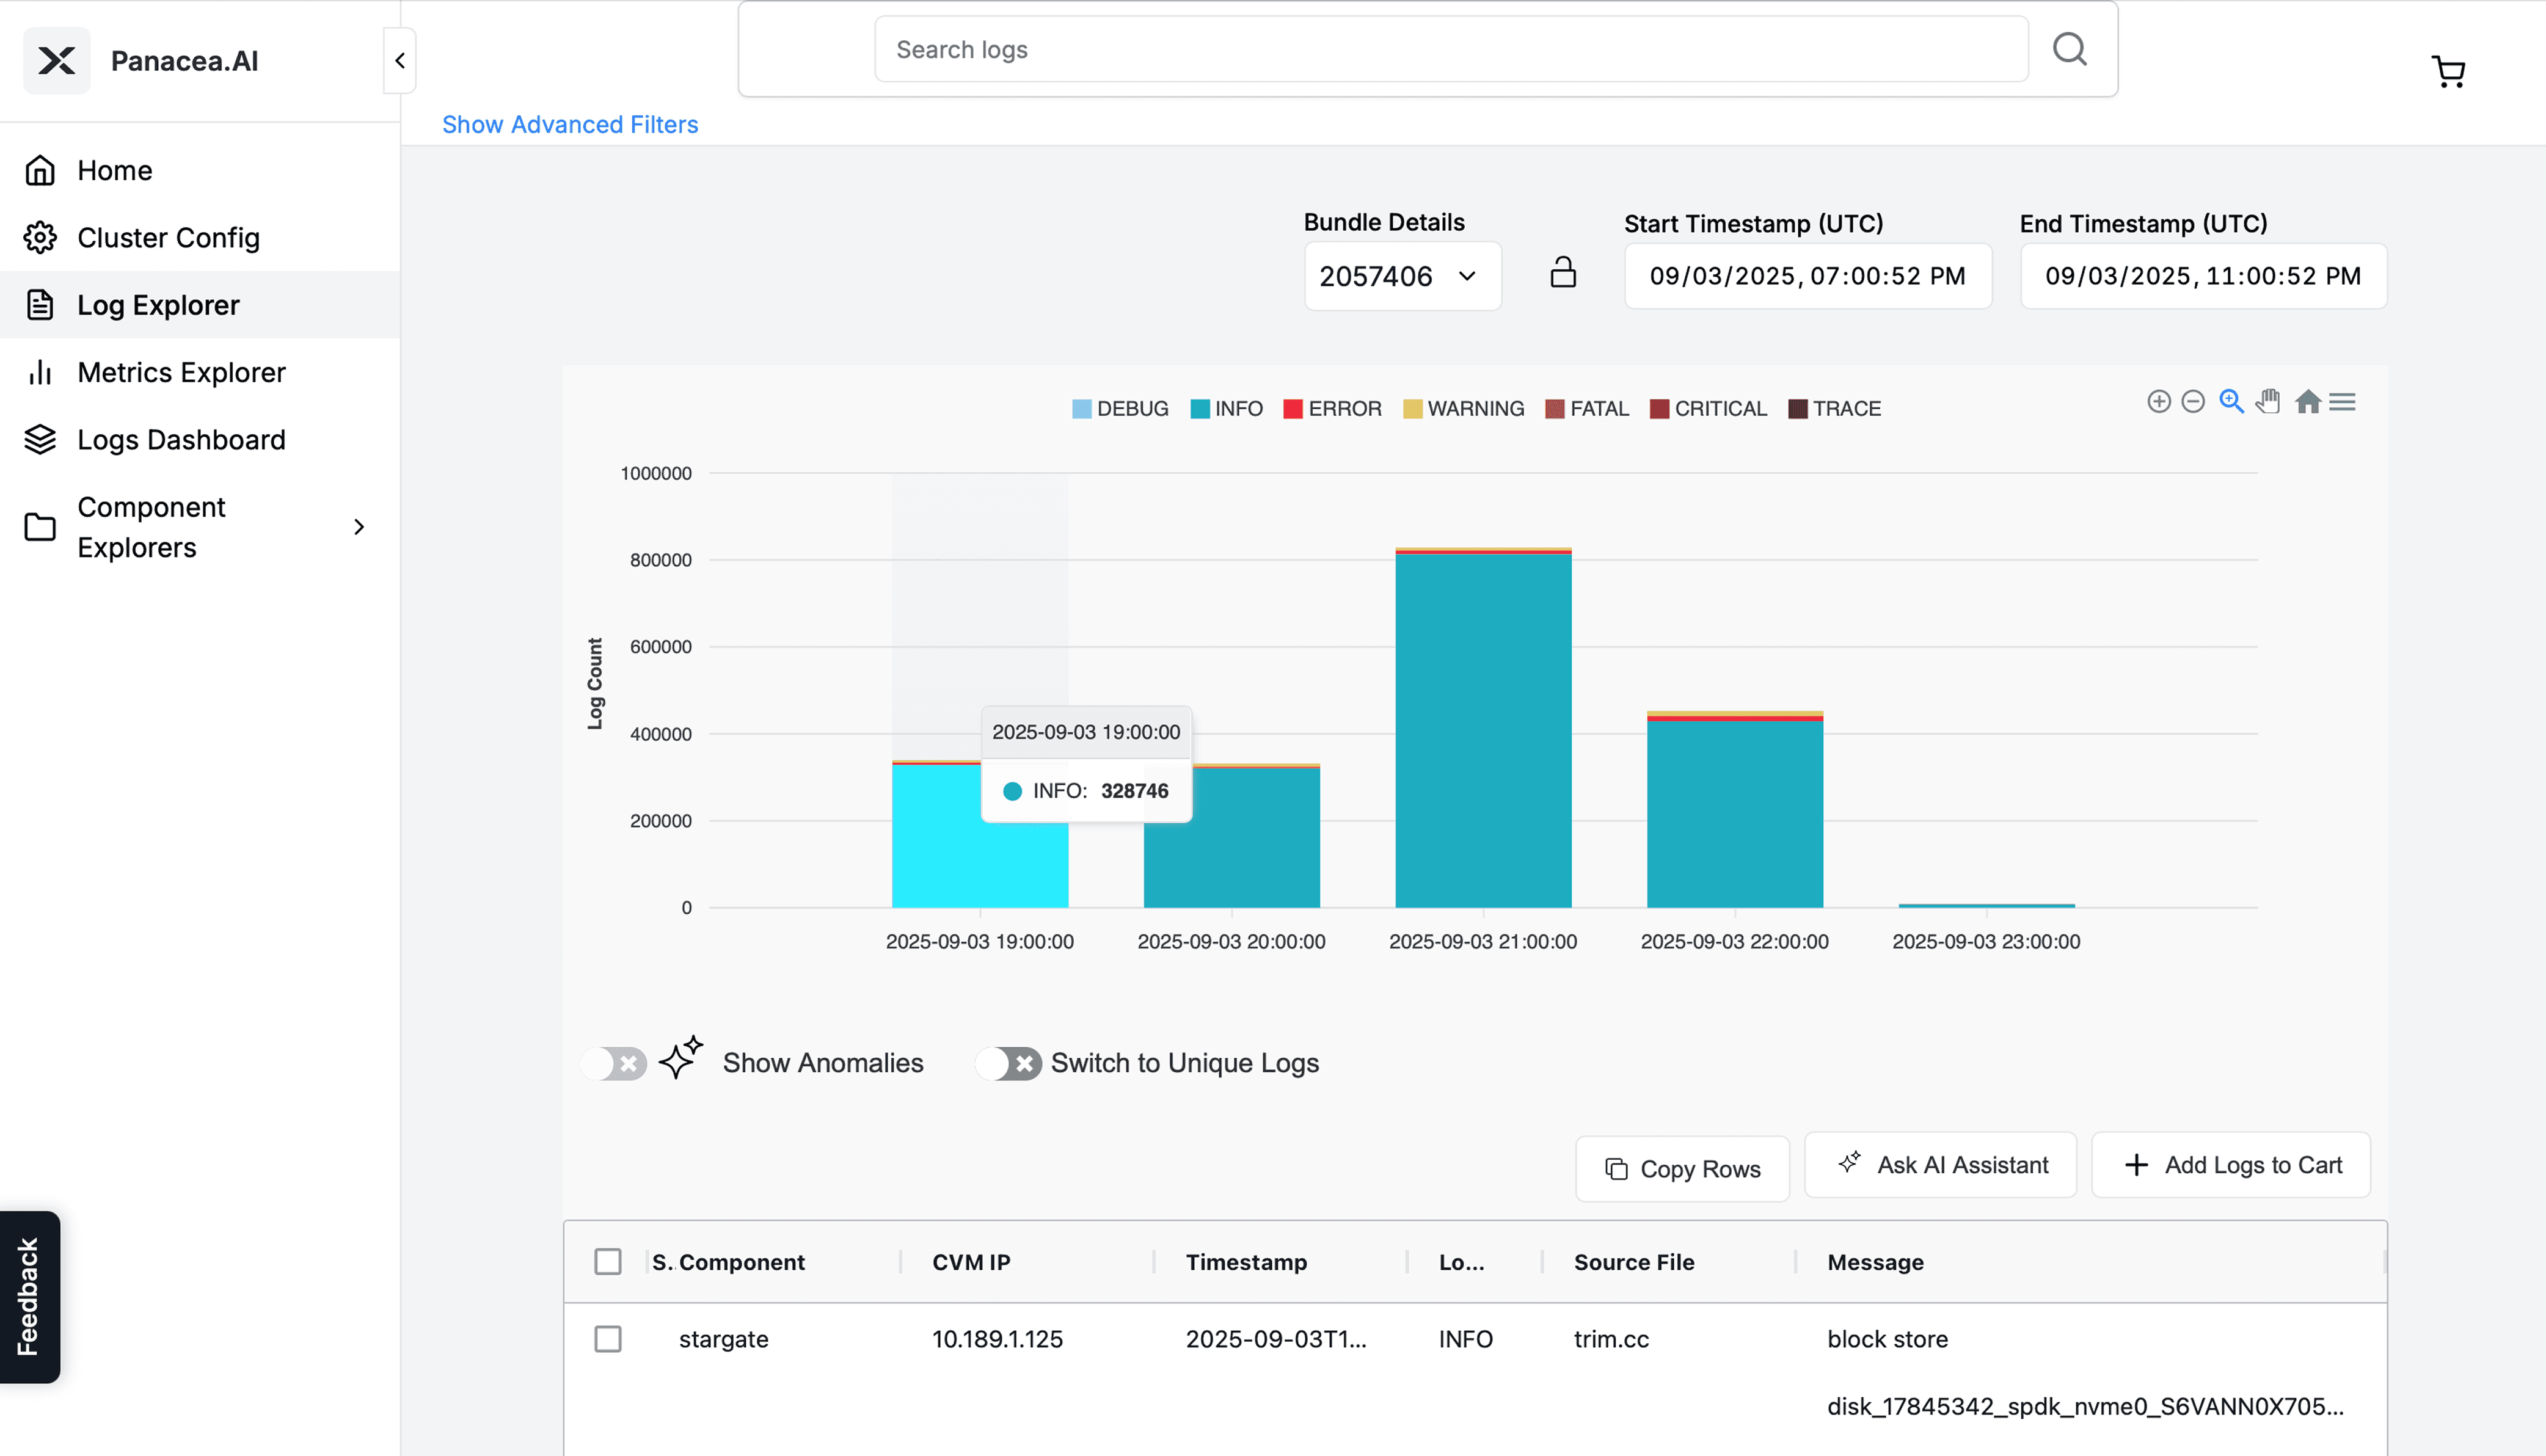
VISUALIZATION
Heatmap & Event Timeline
A temporal visualization of log anomaly density and cluster events.
Lets SREs immediately identify when an issue started and what preceded it
replacing manual log scanning with pattern recognition at a glance.
Before

After


Heatmap & Timeline — pattern recognition replaces manual log scanning
AI FEEDBACK
Add Rule Mechanism
Contextual AI chat enabling SREs to query log data in plain language and surface related KB articles.
Reduces the gap between junior and senior SRE troubleshooting
capability significantly.
CONVERSATIONAL AI
Ask AI
Contextual AI chat enabling SREs to query log data in plain language and surface related KB articles.
Reduces the gap between junior and senior SRE troubleshooting
capability significantly.
INTEGRATION - COMPLETELY NEW
Insights Data & Metrics Explorer
Raw cluster metrics and CVM configuration data from Insights are surfaced directly within Panacea
— eliminating the #1 context switch that previously broke SRE focus during triage.
Before

After

Insights data embedded in Panacea — the #1 context switch eliminated at the interface level
05 — WHAT THE PROCESS FORCED US TO DECIDE
Designing the AI experience, not just the AI features.
DECISION 01
What does the AI say vs. what does the SRE see?
AI output is presented as a structured summary with severity ranking — not raw model output. We designed the information hierarchy deliberately: SREs see conclusions first, supporting evidence on demand. The AI's job is to surface the answer, not create a new format for the SRE to re-interpret.
DECISION 02
How do we handle AI uncertainty without losing trust?
When model confidence is low or signatures are ambiguous, the UI surfaces a "Review required" state — clearly distinguishing "AI found a root cause" from "AI found possible causes." False certainty in a high-stakes ops environment is worse than no AI at all. We designed for the failure mode first.
DECISION 03
How do we close the feedback loop so the AI improves?
The Add Rule Mechanism lets SREs flag misclassifications inline, grounding the model in real operational knowledge. The feedback loop is a first-class design feature. Every correction makes the system more accurate — the design's value compounds over time, not just at launch.
Scalability principle: Every component was designed as a modular pattern that could accommodate AI capability growth — the design system was the infrastructure for future AI features, not just a style guide for current ones. With no fixed AI roadmap, pattern-first was the only responsible approach.
06 — RESOLVING PROBLEM 05
Design as the connective tissue across three teams.
PROBLEM 05 → RESOLVED
Design decisions made in Figma weren't translating cleanly to engineering, and product couldn't communicate changes to leadership without a designer in the room. The fix required design to own the communication layer — not just the pixels. Living specs, API-aligned functional documentation, and PM-ready update decks became as much a deliverable as the screens themselves.
Composable design system
Built for a roadmap without a fixed end-state
Components designed for extensibility — not current requirements but AI capability growth over the roadmap horizon
Every pattern documented with edge states: empty, loading, error, AI uncertain, AI confident — the full state machine, not just the happy path
Modular architecture: Insights data, AI summary, and log views are independently composable — new AI features slot in without a redesign
Cross-team communication design
Making design legible to three different audiences
Living design specs per page — detailed enough for API contracts, legible for PM stakeholder updates to leadership
Functional specs aligned with dev team's API contracts, significantly reducing revision cycles and back-and-forth
Update decks for PM to communicate changes to wider audiences — design owned the cross-team communication layer, not just the screens
07 — IMPACT & RESULT
From 1 hour
to 8 minutes.
87.5%
Reduction in root cause
analysis time
Simplified log analysis via automatic signature detection — eliminating manual pattern matching
Reduced need for manual log investigationthrough AI-curated
log views
Accelerated case triage time with unified bundle + Insights
view
Standardized troubleshooting quality across all SRE experience levels
Multi-bundle analysis enabled previously impossible cross-incident correlation
ClickHouse migration delivered performance and cost savings across engineering
45
UAT Testers
405
Bundles Analyzed
55
Combo
Bundles
8min
Avg Process Time
CUMMUNICATION CHALLENGE SOLVED
Prepared detailed design documentation for all pages, functional specs aligned with Panacea dev team API contracts, and update decks for PM to communicate changes to wider audiences — resolving the three-way communication breakdown between design, engineering, and product.
08 — LEARNINGS
What this project
taught me.
Every feature was born from a real pain point uncovered during research.
Each addresses a specific failure mode in the original workflow.
01
Documentation as Design
Writing clear, accessible design documentation wasn't overhead — it was the primary communication channel that unified three teams with conflicting priorities and vocabularies. Every page had a living spec.
02
Consistency Over Intensity
Recurring, methodical sessions with the end user (Senior SRE) produced more reliable design outputs than intensive sporadic sprints. Cadence created trust. Trust created candor. Candor created better design.
03
Use the Product You Design For
Extensively using Panacea.ai and Insights as a quasi-user revealed UX issues that no brief or PRD would have surfaced. Lived experience in the product generated the most valuable design hypotheses.
04
Multi-Perspective Reviews
Presenting designs within the design team before SRE reviews caught assumptions early and diversified solutions. Peer critique reduced the number of revision cycles with engineering significantly.
05
Design for Scalability First
With no fixed end-vision, every component had to be extensible. This meant advocating for a design system approach and creating modular patterns that could accommodate AI capability growth over time.
06
Design-Driven Feature Discovery
Script Wizard, CVM Configuration, and Insights data integration were all discovered through design exercises — not the PRD. Structured exploration with stakeholders is a legitimate product discovery method.
Enterprise AI design isn't about features. It's about restoring cognitive bandwidth at the moment of highest stress.
Panacea taught me that the best AI experiences are the ones where the engineer stops thinking about the tool and starts thinking about the problem. That's the design goal — not just better UI, but cognitive bandwidth restored for what actually matters.
I care about enterprise design because the stakes are real. A slow RCA isn't an inconvenience — it's a customer's infrastructure down, an SLA at risk, a junior engineer's confidence eroded. Design that solves those problems is worth doing carefully.
Designed & built with care · Edwin Fernandes © 2026
Available for full-time roles
Work
About
Contact
Resume
Edwin Fernandez